
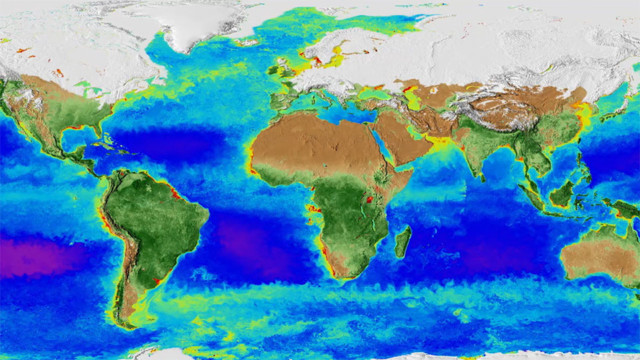
 From space, satellites can see Earth breathe. A new NASA visualization shows 20 years of continuous observations of plant life on land and at the
ocean’s surface, from September 1997 to September 2017. On land, vegetation appears on a scale from brown (low vegetation) to dark green (lots
of vegetation); at the ocean surface, phytoplankton are indicated on a scale from purple (low) to yellow (high). This visualization was created with
data from satellites including SeaWiFS, and instruments including the NASA/NOAA Visible Infrared Imaging Radiometer Suite and the Moderate
Resolution Imaging Spectroradiometer.
PHOTOS/ NASA
From space, satellites can see Earth breathe. A new NASA visualization shows 20 years of continuous observations of plant life on land and at the
ocean’s surface, from September 1997 to September 2017. On land, vegetation appears on a scale from brown (low vegetation) to dark green (lots
of vegetation); at the ocean surface, phytoplankton are indicated on a scale from purple (low) to yellow (high). This visualization was created with
data from satellites including SeaWiFS, and instruments including the NASA/NOAA Visible Infrared Imaging Radiometer Suite and the Moderate
Resolution Imaging Spectroradiometer.
PHOTOS/ NASA
NASA has captured 20 years of seasonal changes in a striking new global map of the home planet.
The data visualization, released this week, shows two decades’ worth of Earth’s biosphere.
Several satellites were used between September 1997 and September of this year, to compile the data. The polar ice caps can be seen expanding and shrinking with the alternating seasons. In addition, the varying shades of blue, green, red and purple in the oceans depict the abundance _ or lack thereof _ of undersea life.
Programmer Alex Kekesi of NASA’s Goddard Space Flight Center in Greenbelt, Maryland, says it took three months to compile the visualization. He says it will be updated over time, as computer systems for combining numerous data sets like this improve.
Story by The Associated Press
New research reveals that the equivalent of 85 billion tons of carbon dioxide is locked in a tropical rainforest in the Democratic Republic of Congo. https://t.co/x5QcGKBSIb pic.twitter.com/rRfaGVqh6B
— NASA Earth (@NASAEarth) November 16, 2017
NASA video shows Earth ‘breathing’ as seasons cycle, climate changes
US space agency NASA has compiled the most complete picture of life on Earth. Scientists used imagery from satellites that circle the planet 14 times every day to create a timelapse that some say shows the planet “breathing” as the seasons cycle and climate changes. Compton Tucker, the top Earth Scientist at NASA, discusses with CGTN’s Asieh Namdar.