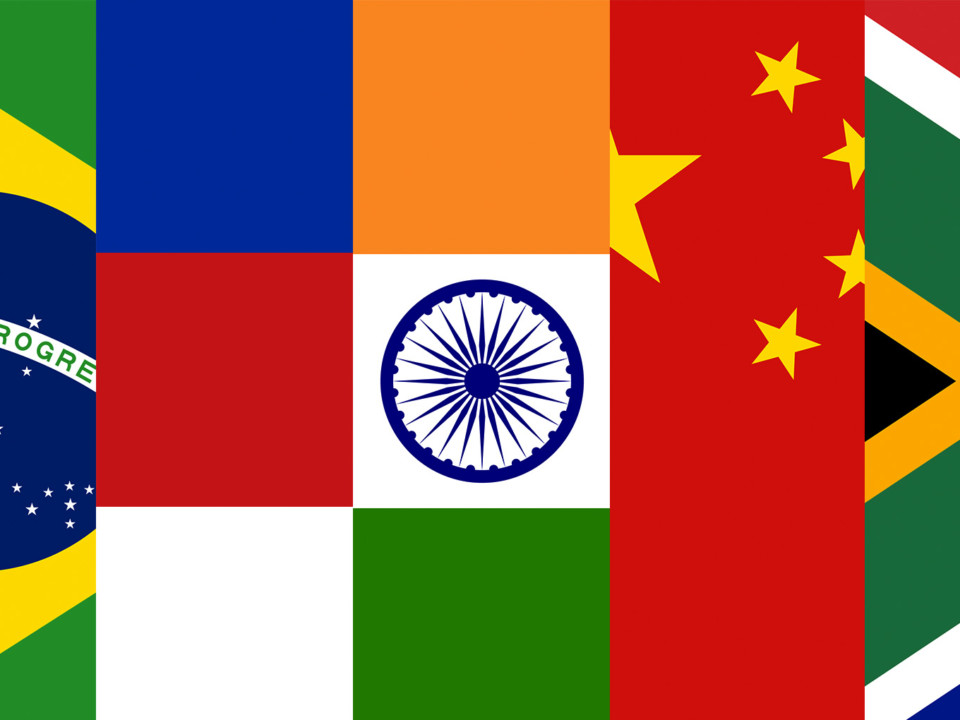
BRICS nations — Brazil, Russia, India, China and South Africa — represent more than 40 percent of the world population and close to a quarter of the world’s nominal GDP, according to data from the World Bank.
Former Goldman Sachs economist Jim O’Neill first grouped them together in 2001, identifying them as some of the world’s fastest-growing emerging economies. However, there are large differences among them.
Here’s a look at data covering a range of measurements that show the similarities and differences among BRICS nations.
BRICS young and old
The median age — meaning half of the population is younger and half are older — of BRICS nations varies quite a bit. South Africa has the youngest median age at nearly 27 years old, while Russia has the oldest median age at 39, according to the CIA World Factbook. For comparison, the median age in the United States is 38 while the median age in the European Union is nearly 43.
Life expectancy varies
While life expectancy at birth has steadily risen over time for Brazil, China, and India — South Africa and Russia have seen less improvement, according to World Bank data.
Life expectancy in South Africa was actually lower in 2015 at 57 years than it was in 1992, when it was 62. Meanwhile, life expectancy in Russia in 2015 was 71 years — about the same as it was in 1998 at 70 years.
Economies show different patterns of growth
The standard indicator of an economy’s health is the Gross Domestic Product, or GDP. The BRICS nation with the largest GDP by far is China at $11.2 trillion, according to data from the World Bank.
India and Brazil have a similiar GDP at $2.2 trillion and $1.8 trillion respectively, while Russia’s GDP was $1.3 trillion, followed by South Africa at nearly $300 billion.
Unemployment rate greatest in South Africa
Unemployment has dogged several BRICS nations, while remaini relatively stable for others, according to data from the IMF and CIA via Statista.
Some nations have more income equality than others
While GDP shows the size of the overall economy, a way to measure the distribution of wealth among people in a country is using the GINI coefficient. This measurement sets the value of 0 as absolute equality and the value of 100 as absolute inequality.
Data from UNDP and the World Bank highlights how much each nation’s distribution of income deviates from a perfectly equal distribution.
Among BRICS, South Africa and Brazil show the most income inequality. Sweden had the lowest GINI coefficient of all nations.
Purchasing power is greatest in Russia, India
Purchasing Power Parity or PPP is an economic concept that relates the exchange rate of currencies to the purchasing power of its people, using the United States dollar as a standard to measure other currencies.
For example, if the same product costs $100 in the U.S. and $50 in another country, the purchasing power parity rate of the other country is 2. The greater the PPP rate, the more goods and services can be consumed in a particular country.
Data from the World Bank shows that alls BRICS nations have greater purchasing power than the United States, with Russia and India showing far greater PPP.
A global problem
Nations across the globe have been working to curb carbon dioxide emissions. In 2016, 195 nations came together to sign the Paris Climate Accord including all the BRICS nations.
The countries agreed to halt global warming and keep global temperatures from rising more than 2 degrees Celsius above pre-industrial levels. Since the signing, U.S. President Donald Trump has said the United States would withdraw from the accord, however under Article 28 of the agreement it takes four years for a country to officially withdraw.
China leads BRICS nations in C02 emissions. The United States is the second largest emitter followed by the European Union, according to data from the World Bank.
 CGTN America


