
 (L-R) A U.S. soybean farm in Maryland and an electronics factory in Zhuhai, China represent the most significant categories of trade between the two nations.
The big news in international trade this week are the tariffs U.S. President Trump has imposed on China steel and other goods. News of these tariffs, and those proposed for other countries, have many worried that an international trade war could be on the horizon.
Trump and his advisors claim a supposed $375 billion trade deficit with China among reasons for tariffs. But, like many things, this trade relationship – and how it relates to the economic health of the U.S. –involves more than a single number.
China’s rapidly expanding market
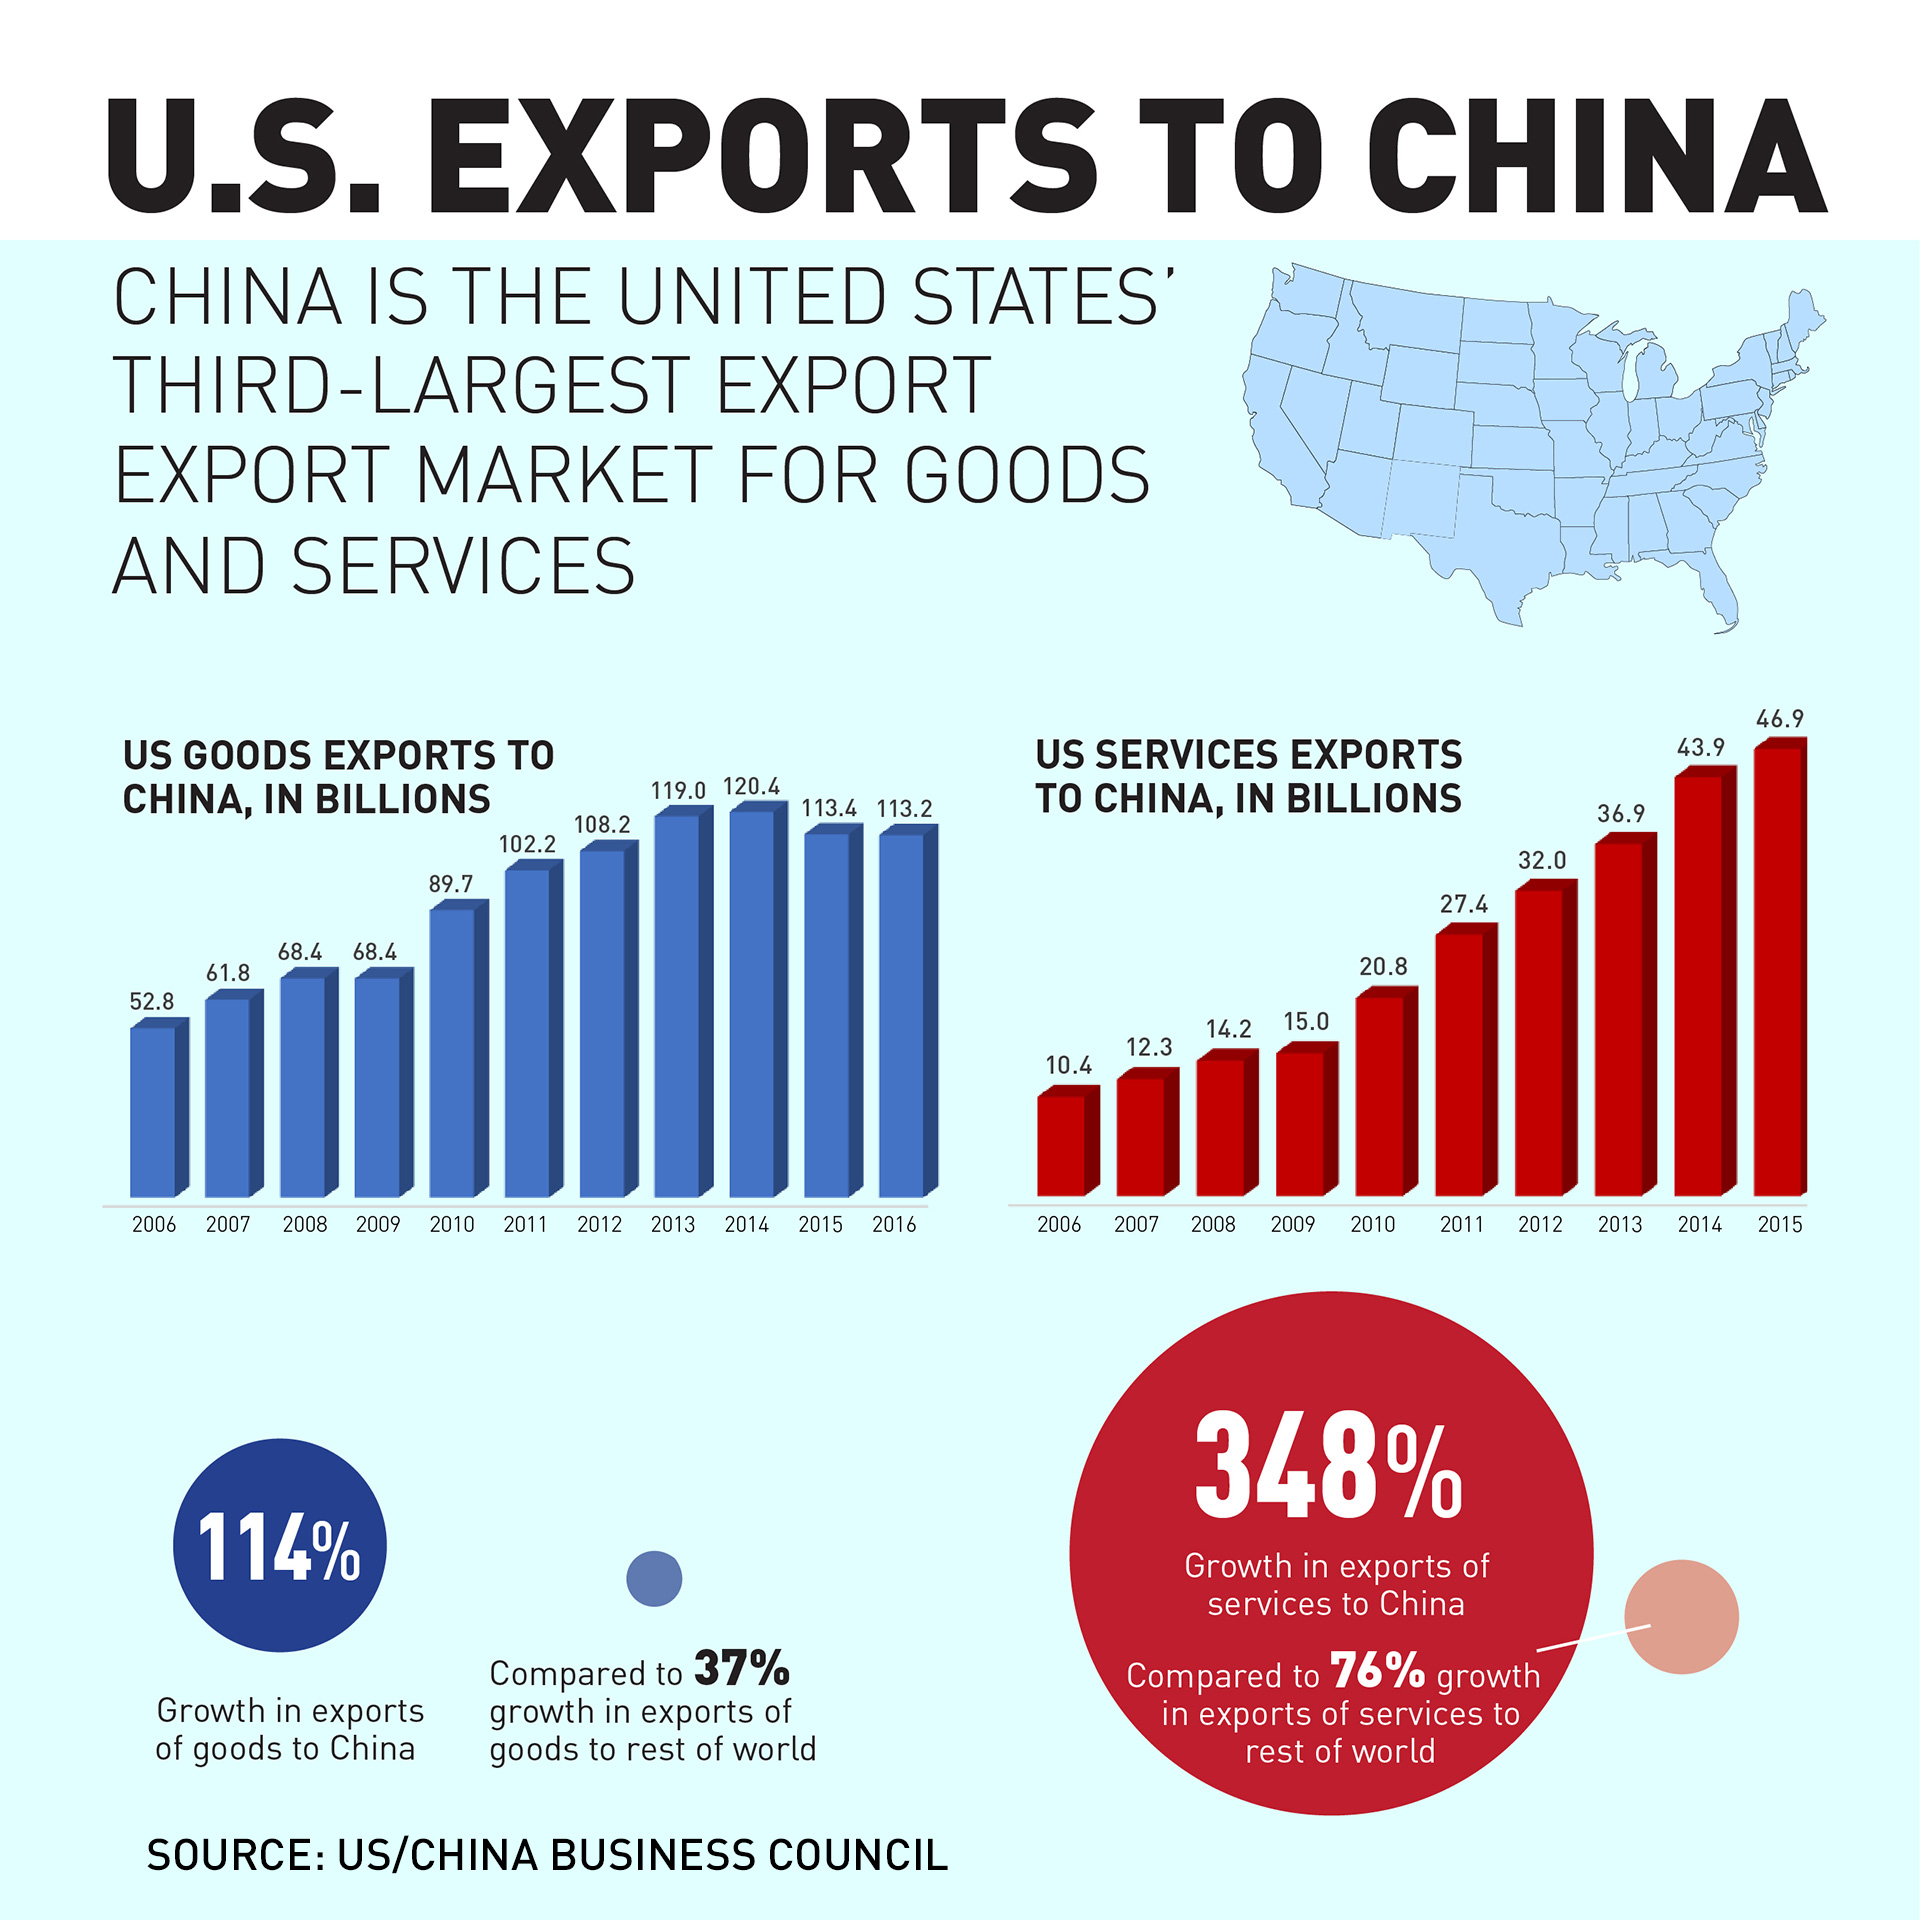
At present, China is the U.S.’s third largest trading partner, only behind Canada and Mexico—who are next door neighbors and co-signers in the North American Free Trade Agreement.
Since China and the U.S. began significant trade in 1985, the Chinese market for U.S. goods has steadily increased from about $3.9 billion in 1985 to $116 billion in 2015.
That’s a nearly 30-fold increase in as many years.
In terms of market growth, China currently leads all other U.S. trading partners. Between 2006 and 2016, U.S. export of goods to China increased 114 percent while exports of services increased a whopping 348 percent.
In fact, service trade with China produced a U.S. surplus amounting to $38 billion in 2016.
 Infographics by Thanh Nguyen and Codey Johnston
GOODS
In terms of goods, The U.S.’s top five imports from China in 2016 were:
- Electrical machinery – $129 billion
- Machinery – $97 billion
- Furniture and bedding – $29 billion
- Toys and sports equipment – $24 billion
- Footwear – $15 billion
While top U.S. goods exported to China were:
- Oilseeds & Grains (mostly soybeans) – $15 billion
- Aerospace Products & Parts – $14 billion
- Motor Vehicles – $8 billion
- Semiconductors & Components – $6 billion
- Navigational & Meas. Instruments – $5 billion
Intermediary Products
A huge sector of the Chinese economy is manufacturing products for foreign companies – especially the U.S. In this model, raw materials are shipped to China and assembled by factory workers there. The final products are then shipped to the U.S. to be sold by American companies in the U.S.
Effectively, many items considered to be “exports” from China, are actually American products.
SERVICES

Travel and tourism top the list of services exchanged between the U.S. and China.
For services, China is the U.S.’s third largest and most rapidly expanding market, valued in 2016 at about $47 billion.
The top U.S. services exported to China include:
- Travel – $26.8 billion
- Royalties & License Fees – $6 billion
- Transportation Services – $4.9 billion
- Business, Professional & Technical Services – $3.7 billion
- Financial Services – $3 billion
Service imports from China to the United States include (Latest data available was for 2015):
- Travel Services – $5.02 billion
- Professional Services – $4.21 billion
- Distribution Services – $3.67 billion
- Electronic Services – $926 million
- Financial Services – $593 million
How U.S. states benefit from trade with China
While the national numbers are important, individual U.S. states also benefit from trade with China.
GOODS
According to the U.S.-China Business Council, 29 states each exported more than $1 billion in goods to the Chinese market. Eleven others reported exports of more than $500 million.
Between 2006 and 2016, thirty states saw a triple-digit growth in goods exported to China. In fact, Alabama, Montana, North Dakota, and South Carolina all saw their exports grow more than 500 percent, during this period.
It’s also interesting to note that the top states exporting to China in 2016 are spread out across the U.S. and represent a variety of industries and products.

SERVICES
Between 2006-2016, all 50 states experienced triple digit growth in their exports to China. Sixteen states (Montana, Indiana, Idaho, South Dakota, North Dakota, Iowa, Maine, Nebraska, North Carolina, Vermont, New York, Mississippi, Missouri, Oregon, Rhode Island, and Pennsylvania) experienced export growth over 400 percent.
In 2015, 14 states provided more than $1 billion in services to China- with eleven other states each exporting services worth $500 million or more.

Postscript: “Jobs, Jobs, Jobs…”
The frequent chant used by President Trump during his campaign — and now his presidency – could be another reason for Americans to reconsider the trade relationship with China.
“In 2016, exports of goods and services to China supported an estimated 911,000 jobs in the U.S.”
Data from the U.S. Department of Commerce shows, in 2015, exports of goods and services to China supported an estimated 911,000 jobs in the U.S. That breaks down to 601,000 supported by goods exports and 309,000 supported by services.
Details and numbers involved with U.S.-China trade can be complex, but many U.S. economists and business executives say it is important to remember China is a growing marketplace.
In March, 45 U.S. trade groups – representing many sectors of the U.S. economy – said the tariffs would “penalize the American consumer.” The petition expressed “serious concerns” about China’s trade practices, but included this warning:
“The imposition of sweeping tariffs would trigger a chain reaction of negative consequences for the U.S. economy, provoking retaliation; stifling U.S. agriculture, goods, and services exports; and raising costs for businesses and consumers.”